Tupper’s Self-Referential Formula
Tupper’s self-referential formula is a single inequality that, when graphed over a specific rectangle in the plane, can display a bitmap image that is encoded inside one very large integer.
The formula
When the left side is true at a point , you color that point (or pixel) black; otherwise, white.
How it works
-
The plot is typically restricted to a rectangle:
- (106 columns)
- for a special integer offset (17 rows)
-
The integer
acts like a huge “data register”. It contains the entire 106×17 bitmap, packed as bits in its binary expansion.
-
The term
computes a bit index:
- picks the column (0 to 105)
- picks the row (0 to 16)
- Multiplying by 17 means each column consumes 17 bits (one per row)
-
The factor
shifts the binary representation of right by that bit index (in a real-number sense).
-
Then
extracts whether the least significant bit is 0 or 1 after shifting.
-
Finally, the outer floor and the comparison
turn that extracted value into a clean boolean decision for coloring.
The “self-referential” part
If you choose to be the integer whose packed bits correspond to the image of the formula itself, then plotting the inequality over and produces that same image. The formula can draw a picture that encodes the formula.
Practical note
The value of for the famous self-plot is astronomically large (thousands of digits). In code, you usually render it by:
- treating the 106×17 region as a pixel grid, and
- extracting bits from a big integer (often using BigInt), instead of evaluating the real-valued inequality point-by-point.
Example Plot
This bitmap behavior can be visualized as follows:
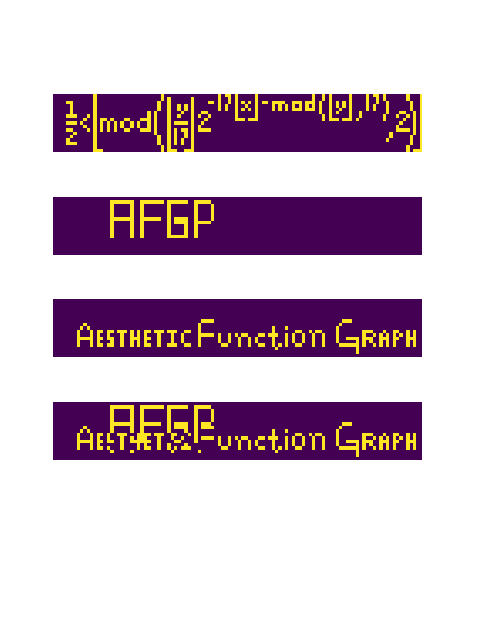
Note that when the two plots are added together, the values get carried over due to binary addition rules, resulting in the original image being distorted by the overlay.